The Bible has a lot to say on the subject of injustice. We know that God is in favor of justice; we know that He is against injustice, even in the most basic terms. The writer of Proverbs mentions this: “The LORD detests differing weights, / and dishonest scales do not please him” (Proverbs 20:23). Justice is foundational to God’s throne (Psalm 89:14), and God does not approve of partiality, whether we are talking about a weighted scale or an unjust legal system (Leviticus 19:15). There are many other verses, in both Old and New Testaments, that give us an idea of God’s distaste for injustice (2 Chronicles 19:7; Job 6:29; 11:14; Proverbs 16:8; Ezekiel 18:24; Romans 9:14).

Consider some recent headlines: “World Bank Warns Of Extreme Volatility In Oil Markets”, “International Energy Agency Head: Oil markets are entering an era of unprecedented volatility” and “Oil prices spike, stocks plummet as uncertainty roils global markets – Washington Post”.
Ebbs and flows of oil prices continued to oscillate throughout 2018 at a greater rate than before. And yes, we had predicted it.
All was calm when I predicted in February 2018 at oil-price.net that mid-June 2018″ would see an upsurge in oil price volatility. Four months later, on June 26, 2018, a volatility spike in West Texas Intermediate crude oil spot price marked the beginning of the turbulent phase in the oil markets that we are now experiencing.
This is the second time at oil-price.net that I have correctly anticipated the timing of turmoil in the oil markets. In an article in late 2013, I accurately predicted the last bout of volatility, which hit in 2014, when oil prices gyrated to lows not seen for nearly fifteen years.
For those who have followed my articles at oil-price.net, which began in early 2010, you’ll know that there is no magic to my forecasts. I may be mildly autistic, but I am not psychic. They are based on a repeating pattern of spiking variance in oil prices that seems to have initiated from around the year 2000. For the last two decades, wave-like palpitations have surged through the oil markets like clockwork every 3 to 4 years.
Who knows whether this pattern will continue going forward, but so far it has confirmed to an ongoing succession with 6, possibly 7 repetitions if one counts a modest bump of increased variance that occurred in 1996.
The chart below illustrates this cycle of volatility in oil prices. The chart’s legend also provides some technical details on the approach I take to analyze it. For folk who may feel a little overwhelmed by this chart, skip it if you prefer. The article can be read, and hopefully understood by well-informed readers, without the chart.
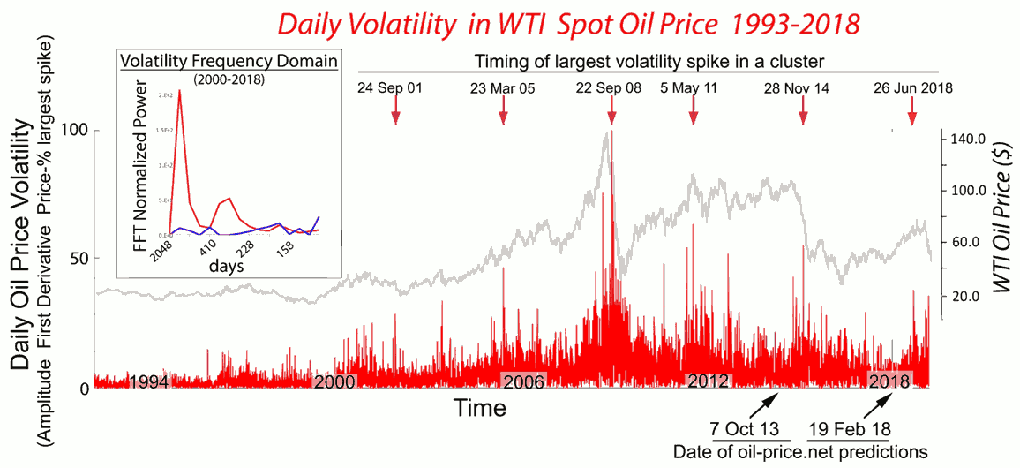
Figure 1 – Grayline on the main chart: Daily WTI crude oil spot prices ($) from 1993 to 2018. Redline on the main chart: Volatility in West Texas Intermediate (WTI) Crude Spot Price calculated as the amplitude of the first derivative of daily price over the same period. Red arrows over gray and red plots point to the largest volatility spikes in clusters of spikes that occur every 3 to 4 years after the year 2000. Black arrows on “Time” axis correspond to dates of publication of my oil-price.net articles predicting that volatility in price will ensue shortly thereafter. Inset shows the fast Fourier transformation (FFT) frequency domain of volatility in oil prices over the period from 2000 to 2018. Redline on the inset chart: is the FFT frequency domain of price volatility in the daily time series over this period, indicating a dominant frequency at 1024 trading days. The blue line on the inset chart is the FFT re-performed on a randomized time series of the same data. This latter calculation is done as a control, to show that the dominant frequency at 1024 trading days is no longer evident when the daily values for volatility are shuffled randomly.
Contemplate some further headlines of late: “Big Swings in Stock Market Are at Their Highest Level Since 2011 – New York Times” “Stocks Waver on Last Day of Turbulent Week – Wall Street Journal”, and “Stocks flip between gains and losses as Wall Street prepares to wrap up week of wild swings – MarketWatch”.

I made a second prediction last February based on past observations. Namely, that if a surge in oil price volatility occurred mid-2018, then 6 months or so later, “it will be followed by a crappy period in the stock market”.
As indicated by the news reports above, this forecast has also been confirmed. In December, some 6 months after the first oil volatility spike in June, the Dow Jones Industrial average had a sudden decline that saw some 20% of its value lost. In equally short order, the Dow had a whipsaw recovery, but the “crappy period” in the equity markets may not be over yet.
I have to say that my feeling about being right again are mixed. My hyper-focused Aspie brain feels some small satisfaction. The work that it has taken to unriddle and document this phenomenon over many years has been considerable. But, my heart is sad, as I believe that real hardship may be in the offing. This is because of the steady and uninhibited flow of oil is the lifeblood of our civilization. I believe that the repeating pattern of bursting chaos that we’ve seen emanate from the energy markets over the last two decades is a symptom that all is not well and that the situation may not calm, but worsen, going forward.
Oil Price Instability Indicates That The 300 Year Era Of Fossil Fuel May Be Entering A Culminating Phase
I have been partial to the 19th-century British painter JMW Turner since I was a child. A few years ago, I stood wonderstruck inches from his great painting “The Fighting Temeraire – 1838”, then on exhibition at the Royal Naval Academy in Greenwich, London.
Shivers ran down my back as I stared into the painting’s rough surface, depicting the final journey of an old wooden warship. The Fighting Temeraire – a veteran ship of the line at the battle of Trafalgar – is shown being towed to the wrecker’s yard by a then, new-fangled steam tug. An eccentric sun sits on the horizon, suffusing the poignant scene with gentle evening light.
Another favorite is “Rain, steam and speed – 1844” with its train coming at the viewer like a bat out of hell from a pastoral of cloud, river, forest, and mountain. The verdant backdrop that the train speeds away from is classical, diffuse and mysterious – as finely wrought as any da Vinci.
Turner’s sublime gift was to capture the sentiment of a world on the verge of momentous change. The industrial revolution was being fueled by coal and its thunderous engines heralded new prosperity. But these noisome machines also portended the passing of a simpler epoch with its predictable agrarian rhythms, beasts of burden and technologies made by hand.
One wonders how the artistic sensitivity of Mr. Turner might have responded to the current juncture, which I believe marks another of history’s major shifts in phase.
It is my firm view that the cycle in oil price variance that we have witnessed for the last two decades is a clear sign that our planet’s tolerance for the exploitation of fossil fuels is reaching its limits. Indeed, it signals the culmination of the process whose beginnings JMW Turner observed and recorded with such beauty.
Instability In Oil Markets May Be At The Root Of Our Political Problems As Well
I have argued for some time that the repeating pattern of oil price instability, and its coupled dance with the stock market, is not just a matter of finance and economics. Oscillating like a pulsing dark star, it seems to be beaming mayhem into our political and social arrangements as well.
I explored this in one of my past articles, going to the trouble of generating time series of derivatives from political polling numbers in the US and then using the same Fourier transforms on these data that I use to pick out the repeating pattern in oil price volatility.
This analysis revealed that shifts in political sentiment in the US show remarkable correlation with the pattern of swings in oil prices over time.
Bringing this down to earth for those like me who struggle with math (albeit that I still enjoy it), reflect on the outcomes of the last three US presidential elections. It’s dimming into the past now, but at the time of Barack Obama’s emergence into national politics, the odds that he’d become our first black president seemed low. Then the oil shock and financial crisis of 2008 hit and Mr. Obama unexpectedly won, handily defeating Mr. McCain, who though gruff and a little eccentric, was eminently electable by the standards of all the other old white dudes who have led our country since 1789.
And then – after the decent and ultimately conventional Mr. Obama – a nemesis. The unpredictable Mr Trump, whose person, it seems fair to observe, is the incarnate essence of our time – the very embodiment of the new age of volatility.
Recently, the unruly consilient signals from the markets, politics, as well as the environment were the subject of an excellent article by Canadian author and journalist Andrew Nikiforuk. And naturally, I found his piece excellent, as Nikiforuk quoted directly from my oil-price.net writings, nicely summarizing the Therramus perspective. He also did a good job covering the work of fellow oil doomsayer Gail Tverberg, who has an influential blog “Our Finite World”.
He writes, “This new volatility in oil prices is analogous to other trends like the increasing frequency of wildfires in forests destabilized by drought and climate change.”
Sadly, Nikiforuk is one of the few professional journalists who has ventured into this area and grasped its “big picture” implications. A glance at any newspaper, market news website or TV show and you will find that the only factors are given credence for their impact on oil prices, and for that matter most market indices, are day-to-day. But logically, the obsessively short-term bias of the media, with its focus on this week’s move by the Fed, or last month’s meeting of OPEC or that tweet from Donald Trump, is nonsensical. Such explanations cannot explain an oscillating structure (i.e., that shown on the chart), which is embedded in a nearly 20-year time span.
To put this another way, my correct predictions at oil-price.net on February 19, 2018, of coming upsurges in oil price and equity variance, were based on the fact that June 2018 marked the anticipated timing of the next wave of volatility from a cycle that initiated at the turn of the millennium. Whilst coincident inputs from the Fed, OPEC or the President etc might exacerbate its amplitude, the ultimate cause of turmoil in the markets in the latter half of 2018 is baked into the long-term pattern illustrated in the chart above.
My “Oil Bet”
It is said that the President is an idiot and of late he has joined the chorus of media cognoscenti. In his case, the straw he has grasped at was to blame the chairman of the Federal Reserve for the recent difficulties in the stock market. It is likely that he did so to deflect criticism for his own actions on trade, China and shutting down the government, which many views to be contributory factors to the recent market swoon.
There is a tribal, partisan instinct in me that sincerely wishes to find fault in Mr. Trump. But ultimately, I am convinced the tail-chasing focus on proximal causality that both he and his critics pursue is ludicrous. Mr. Trump can no more be held to account for what is going on than his predecessors. It could be argued that past leaders are more culpable, as the signs of distress have been with us for nearly a generation.
The widespread inability, or lack of willingness, to understand our present situation on time scales of anything other than weeks and days has long perplexed me. In May of last year, I received an unexpected royalty payment on one of my patents. It was welcome, but I really did not need the money, so I decided to put it into an exchange-traded fund (ETF) that tracks the price of West Texas Intermediate crude oil. My plan was to try and shift my perspective by creating a conflict of interest and then document my response.
So, the results of the experiment are in and it turns out that I am also an idiot. I have lost money, big time. But worse, the margins of the Excel spreadsheet documenting what I call my “oil bet” are full of daily speculation on actions by the Saudi and Russian governments and what the Iranians are up to in the Gulf of Hormuz. In a further move toward the quotidian orientation for which I find fault in others, I have also begun musing about how to model short-term variances in my oil ETF mathematically in order disclose and exploit any underlying structure.
My investment has also been significantly up at points over the last year, but heck, it’s a volatile market.
Our Addiction to Oil
There is a colleague at the research institute where I work who is renowned for his original contributions to drug addiction. I won’t embarrass him by revealing his name, but if he ever reads this article he’ll knows who he is.
The question that his work addresses are how much worth do humans place in the future. By asking people questions like – Would you take $80 now or $100 in a month? – he can measure with precision the value that different individuals discount a delay in a future reward. I won’t go further into his methods or results except to say that two key numbers are 9 days and 4 years.
On average, drug addicts place as much value on the next 9 days as non-addicts do on the next four years.
We are all human and each of us expresses frailty in our own way, but unsurprisingly, those who value the future in days rather than years tend to make all sorts of bad decisions on drugs, sexual partners, smoking, alcohol, food intake, gambling … name your vice.
Whilst such behaviors take a destructive toll on individuals, I have begun to wonder whether the difference in the degree to which so-called addicts and non-addicts discount the future is really that different, especially when viewed from a broader perspective. If one considers the time course of the issues that we now face, including the economic, political and environmental (e.g., climate change) challenges that appear to be stemming from over-use of oil and other hydrocarbons, a 4-year period still seems like a rather narrow frame. You might even see it is part of the problem that, at an optimum, most brains are not really wired to go much beyond a 5-year plan.
A few months back I read “The Hidden Life of Trees” by German forester Peter Wohlleben. In his book, Wohlleben skillfully creates a perspective for his reader of a living organism who might dwell in an immature, child-like phase for 10s to 100s of years, and whose life span at maturity could span 100s or even 1000s of years.
The author also points to the intertwining, branching root systems of trees, and their fungal commensals, noting that they are capable of conducting electrical impulses and have levels of complexity comparable to networks found in the brain. Wohlleben slyly hints at the possibility that tree root systems may process information in a manner resembling neural networks i.e., trees have some level of cognition.
One has to be careful not to be anthropomorphic. Nonetheless, Wohlleben’s book had me pondering. What if humans had the 5000-year lifespan of the Methuselah Bristlecone pine or could match the 4000 years of the Llangernyw Yew tree? Surely, our discounting of the future would extend out much further than 4 years? Also, would our exploitation of resources such as fossil fuel change if we knew that we would personally have to live with the consequences, rather than fobbing these off on our children, their children and so on?
And what if trees could think? How might they regard us, humans? As hopeless addicts, I suspect. Source
Coffee closed Monday with significant losses as investors are extending its profit taking from the 116.00 area. However, news that a frost front in Brazil affecting key coffee areas could push prices up again.
According to Reuters, “Brazil is in the middle of coffee harvesting, and any impact would be felt only in next year’s crop. Traders were expecting a record crop in 2020 when the country returns to the one-year in the biennial arabica cycle. But it is unclear now whether production could surpass the 2018 record near 62 million 60-kg (132 lb) bags.”
Prices of coffee fell to 105.20 on Monday, its lowest level since June 25. It is now trading at 106.85.
StevieRay Hansen
Editor, Bankster Crime
MY MISSION IS NOT TO CONVINCE YOU, ONLY TO INFORM…
#Fraud #Banks #Money #Corruption #Bankers,#Powerful Politicians, #Businessmen

![]()