Bulls Charge To All-Time Highs
As discussed previously in “Insanely Stupid,” we noted the market remained confined to its consolidation channel, but the bullish bias was to the upside.
“While the market has not been able to push above the recent July highs, support is holding at the rising bullish trend line. With the short-term ‘buy signals’ back in play, the bias at the moment is to the upside.
However, as we have discussed over the last couple of weeks, July held to its historical trends of strength. With a bulk of the S&P 500 earnings season behind us, we suspect the weakening economic data will begin to weigh sentiment in August and September.“
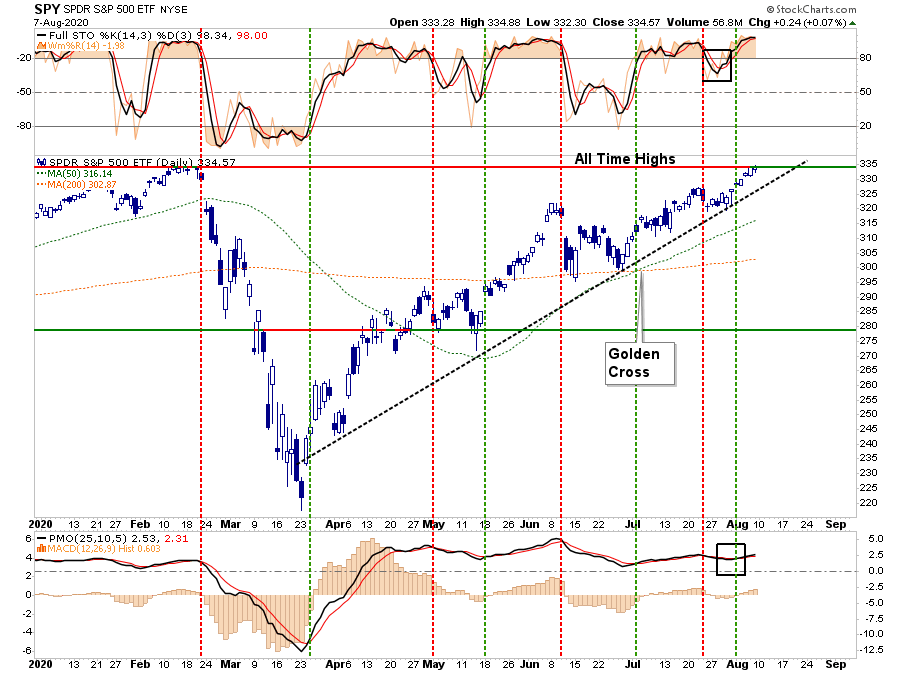
While weaker economic data has not yet dented the “bullish sentiment” at this juncture, it doesn’t mean it won’t. However, as we have discussed over the last several weeks, a breakout of the consolidation range, which was capped by the June highs, would put all-time highs into focus.
A Weighted Distortion
The concern is that what you see with the market, is not necessarily what you get. The chart below shows the number of stocks trading above the 200-dma versus the S&P 500 trading above its 200-dma.
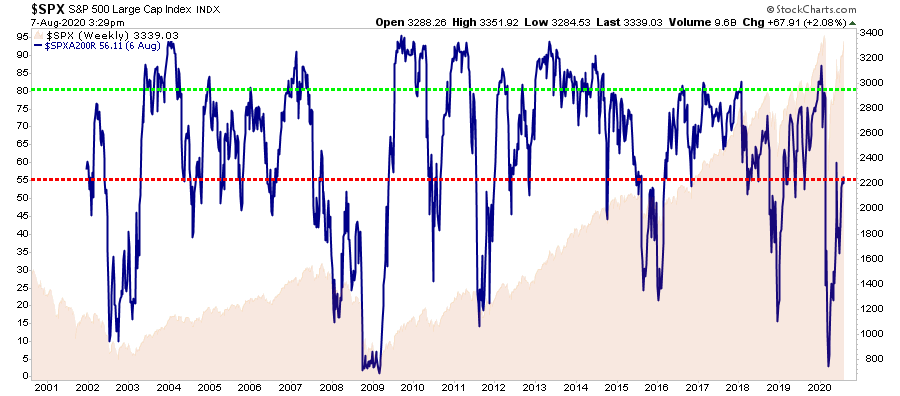
In theory, if the “market” is above its 200-dma, then a large number of stocks, usually about 80%, should also be. However, such is not the case, as only 55% currently do so.
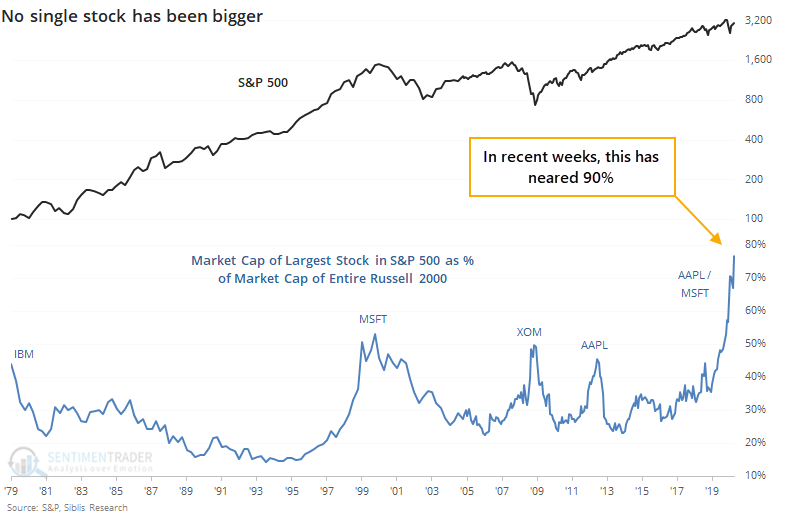
The market is currently being driven to new highs by the “chase” into the largest mega-capitalization stocks. Sentiment Trader noted this on Friday:
“The biggest stock in the U.S. and nearly the world, Apple, keeps powering higher. At the end of June, the value of Apple alone was nearly 80% of the Russell 2000 index’s market capitalization. As of today, it’s nearly 90%. This is astounding – in the past 40 years, no single stock has come close to dwarfing the value of so many other companies.“

By itself, this data point does not have a lot of historical relevance. However, it does tend to be more of an indication of underlying “exuberance” in the market.
The point here, however, is the top-5 stocks are distorting the overall market participation.
Let Me Explain The Math
Currently, the top-5 S&P stocks by market capitalization (AAPL, AMZN, GOOG, FB, and MSFT) make up the same amount of the S&P 500 as the bottom 394 stocks. Those same five also comprise 26% of the index alone.
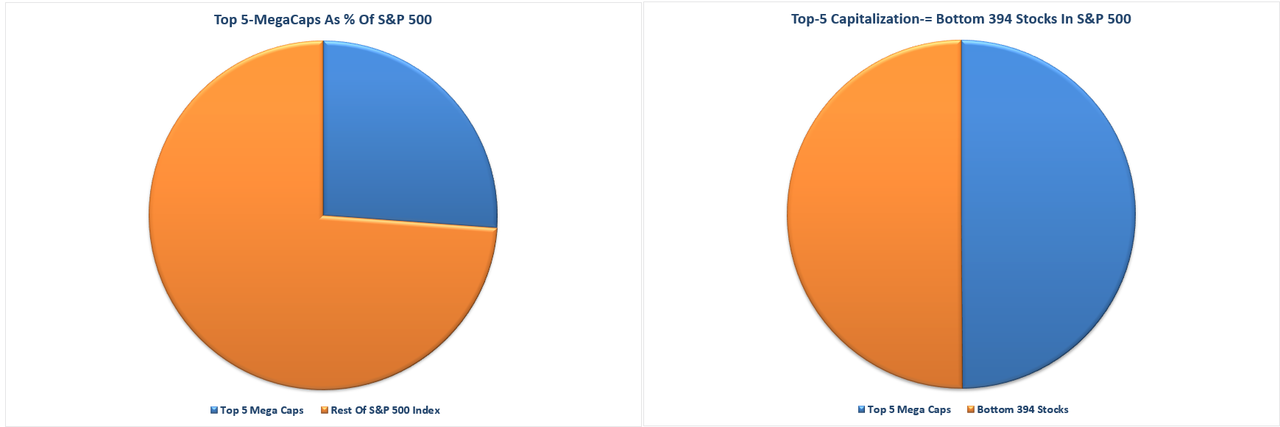
What investors are missing is that the top-5 stocks are distorting the movements in the overall index.
For each $1 put into each of those top-5 stocks, the impact on the index is the same as putting $1 into each of the bottom 394 stocks. Such is clearly not a true representation of either the market or the economy.
As we have noted recently, if you own anything OTHER than those top-5 stocks, your portfolio is likely underperforming the market this year.
Exuberance Abounds
This past week, we discussed with our RIAPro Subscribers (Try Risk-Free for 30-days) the dangers of chasing markets, which have deviated extremely from their long-term means. The risk, of course, is that markets always, without exception, revert to the mean. The only question is the “timing” of the event.
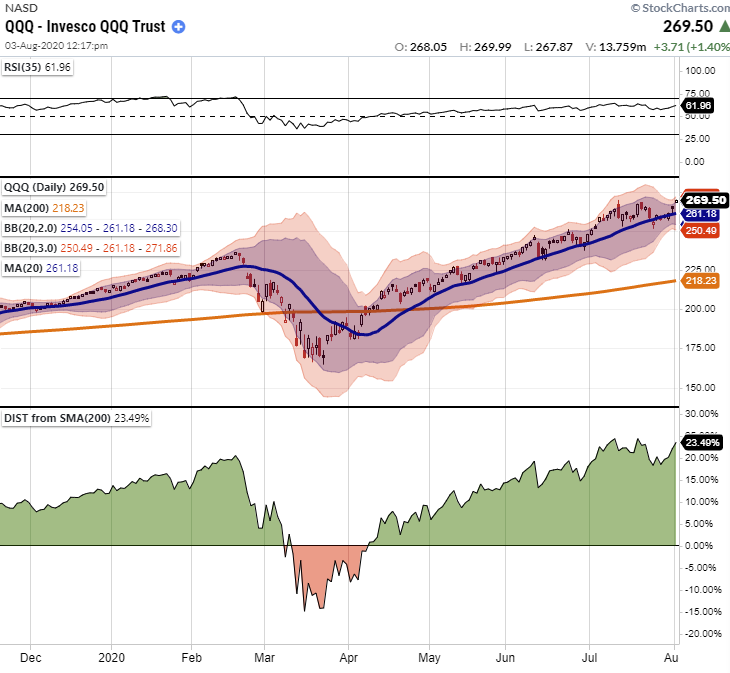
Specifically, we noted the deviation of the Nasdaq from its 200-dma, which remains near a record high.
“Moving averages, especially longer-term ones, are like gravity. The further prices become deviated from long-term averages, the greater the ‘gravitational pull’ becomes. An ‘average’ requires prices to trade above and below the “average” level. The risk of a reversion grows with the size of the deviation.
The Nasdaq currently trades more than 23% above its 200-dma. The last time such a deviation existed was in February of this year. The Nasdaq also trades 3-standard deviations above the 200-dma, which is another extreme indication.
Such does not mean the market is about to crash. However, it does suggest the ‘rubber band’ is stretched so tightly any minor disappointment could lead to a contraction in prices.”
Again, this deviation is driven by the largest cap-weighted names. Still, there are also more extreme signs of speculative appetite currently flowing into the markets.
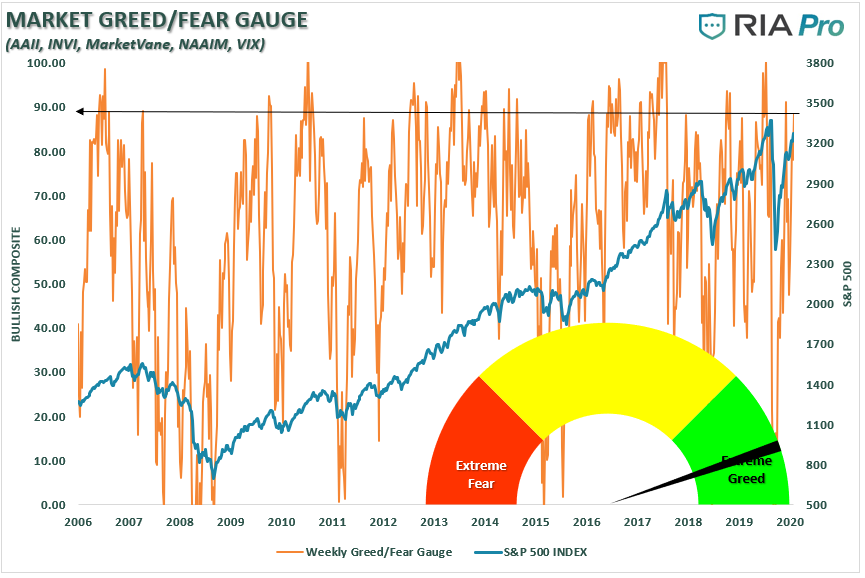
The Greed Factor
The RIAPro sentiment gauge, which is based on actual investor positioning, is at more extreme levels.
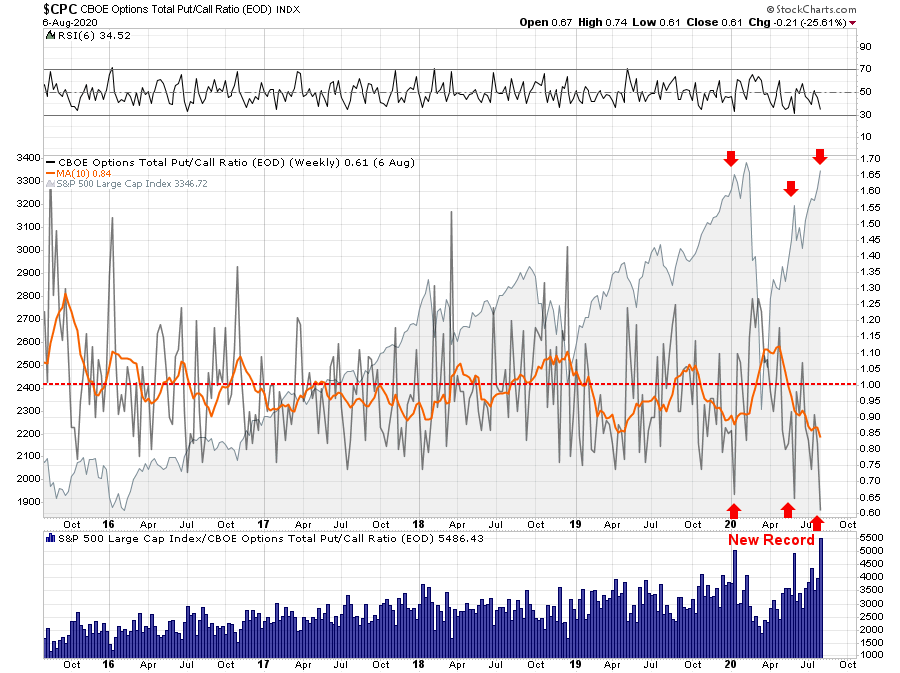
The put/call ratio is also at a historic low, which suggests that investors have given up hedging risk in portfolios entirely. I have marked the previous points where the put/call ratio was this imbalanced.

Importantly, this is all very “bullish” for now.
The point about these indicators, is that in the short-term (a few days to a few weeks) it suggests the markets will likely continue to rise. Such is because “momentum” is a tough thing to kill.
However, longer-term, they have a long history of suggesting increasing levels of risk, which eventually leads to less pleasant outcomes.
The Megaphone
In the short-term, there seems to be little worry about. I thought this sentiment was summed up best by Jeffrey Marcus, who manages the TPA Analystics long-short portfolio for RIAPro:
I think I have figured it out-all outcomes are good for assets. Either the economy recovers=good or Covid gets worse, more stimulus, no evictions, foreclosures, more FED=good. Always good when there is an infinite printing press. @TpaResearch @LanceRoberts @michaellebowitz

However, in the longer-term, the bulls may be walking into a trap.
While the bulls are chanting “all-time highs,” it falls within the context of an ongoing topping process referred to as a “megaphone” pattern. Here is the definition:
“A broadening formation is a price chart pattern characterized by increasing price volatility and diagrammed as two diverging trend lines, one rising and one falling.
These formations are relatively rare during normal market conditions over the long-term since most markets tend to trend in one direction or another over time. The formations are more common when market participants have begun to process a series of unsettling news topics. Topics such as geopolitical conflict, a change in Fed policy, or a combination of the two, are likely to coincide with such formations.
Broadening formations are generally bearish for most long-term investors since they are characterized by rising volatility without a clear move in a single direction.”
It’s Just A Chart
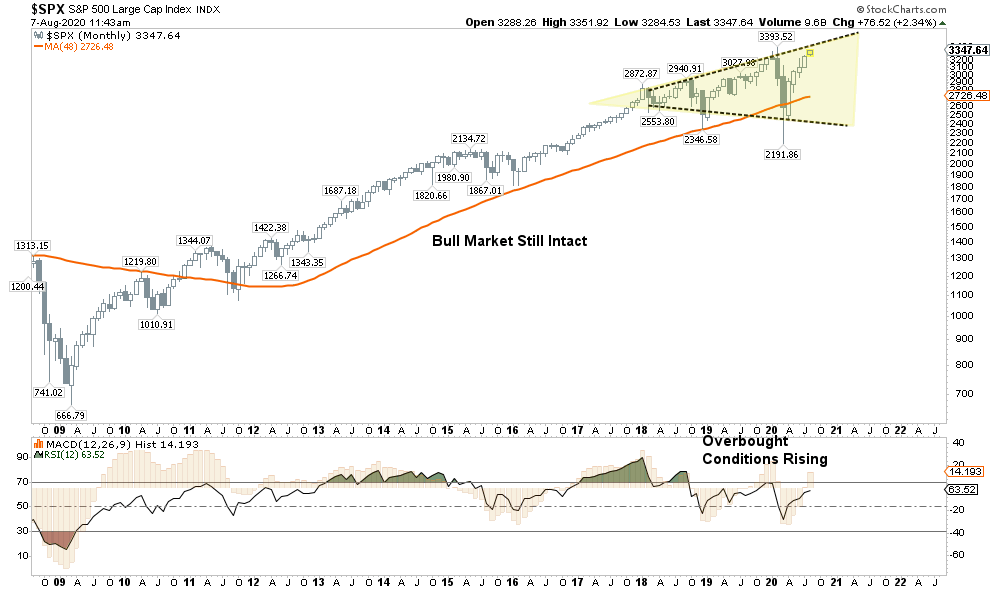
This broadening, or megaphone, pattern is seen below on the monthly chart. Importantly, despite the “correction,” in March, the “bull market” that began in 2009 remains intact as the low monthly close did not break the 4-year moving average.
Furthermore, this is a “monthly” chart, so it is very slow to form. As such, it is critical to consider this analysis in context. The chart does not mean the markets are about to crash, nor is it a useful tool to try and “time” the market.

The market will hit new highs as it reaches the top of the upper trendline, where it will meet more formidable resistance. With the market back to a more extreme overbought condition, the “low hanging fruit” has been picked.
Risk/Reward Ranges
Nonetheless, as discussed below, the current levels of “bullish sentiment” and “momentum” keeps our portfolios allocated toward “risk.” However, we are moving closer toward the “exit,” so we are not the last one trying to get out of the theater when someone yells “fire.”
With the markets closing just at all-time highs, we can only guess where the next market peak will be. Therefore, to gauge risk and reward ranges, we have set targets at 3500, 3750, and 4000 or 4.4%, 12.2%, and 19.5%, respectively.
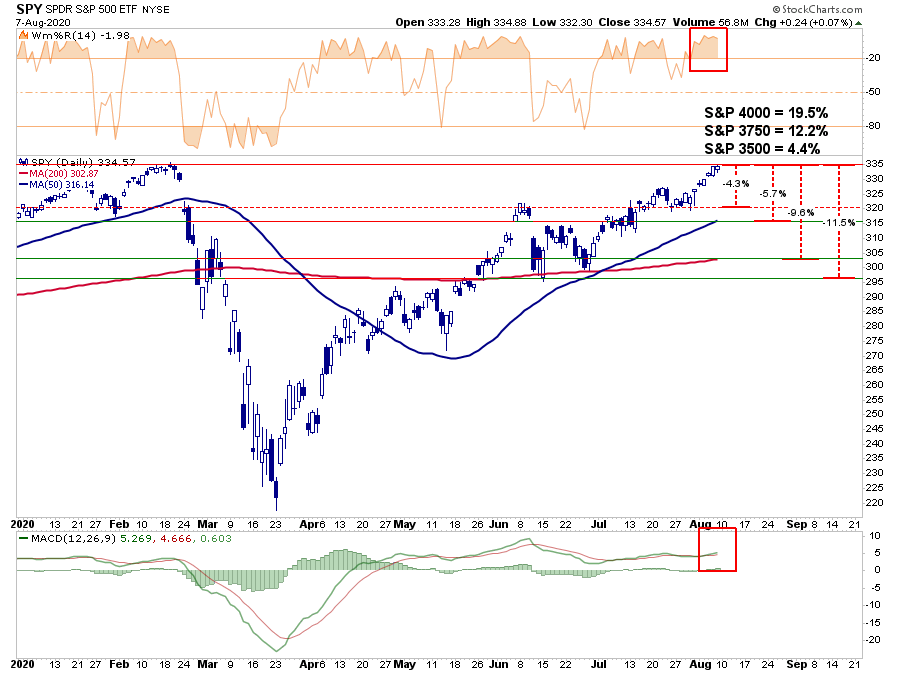
Here are the current risk/reward ranges:
- +4.4% to 3500 vs. -4.3% to June high breakout support.
- +4.4% to 3500 vs. -5.7% to the 50-dma.
- +12.2% to 3750 vs. -9.6% to the 200-dma
- +12.2% to 3750 vs. -11.5% to the June consolidation lows.
- +19.5% to 4000 vs. -22.17% to the March closing low. (Not shown)
Given there is no good measure to justify upside potential from a breakout to new highs, you can personally go through a lot of mental exercises. While there is certainly a potential the market could rally 19.9% to 4000, it is also just as reasonable the market could decline 22.2% test the March closing lows. Completion of the “megaphone pattern” discussed above would be a 37.43% decline.
Just in case you think that can’t happen, just remember no one was expecting a 35% decline in March either.
As we said last week, “risk happens fast.”
Source: ZeroHedge
StevieRay Hansen
Editor, BankstersCrime
God often uses men who are not of the best moral character. Pharaoh, Nebuchadnezzar, Cyrus, Herod, and Trump (amongst others), to accomplish His will in events He orchestrates during human history. We either trust the sovereignty of God or we don’t. Nothing happens apart from Him…
The best index to a person’s character is how he treats people who can’t do him any good, and how he treats people who can’t fight back…
The Birth Pains Are Growing Stronger….
One of the signs of ruling class collapse is when they can no longer enforce the rules that maintain them as a ruling class. When the Romans started making exceptions to republican governance, it was a matter of time before someone simply decided the rules no longer applied to them. Perhaps the robot historians will consider Obama our Marius or Sulla. Maybe that person is in the near future. Either way, the rule of law is over and what comes next is the rule of men.
“Don’t piss down my back and tell me it’s raining.” Outlaw Josey Wales
![]()


