I rarely discuss financial markets these days. Although I pay attention, it’s not in the obsessive manner I did a decade ago. I mainly keep my eyes out for potential big macro turning points, and if I see something interesting in that regard, I try to share it with readers. This means I might not mention markets for months at a time, if not longer. I think the setup right now is unique enough to provide a few thoughts.
The only chart or ratio I really pay attention to is SPY/GLD, which is a proxy for the S&P 500 priced in gold. In my view, a real equity bull market is characterized by equities rising and hitting new highs in gold terms, not just in nominal terms.
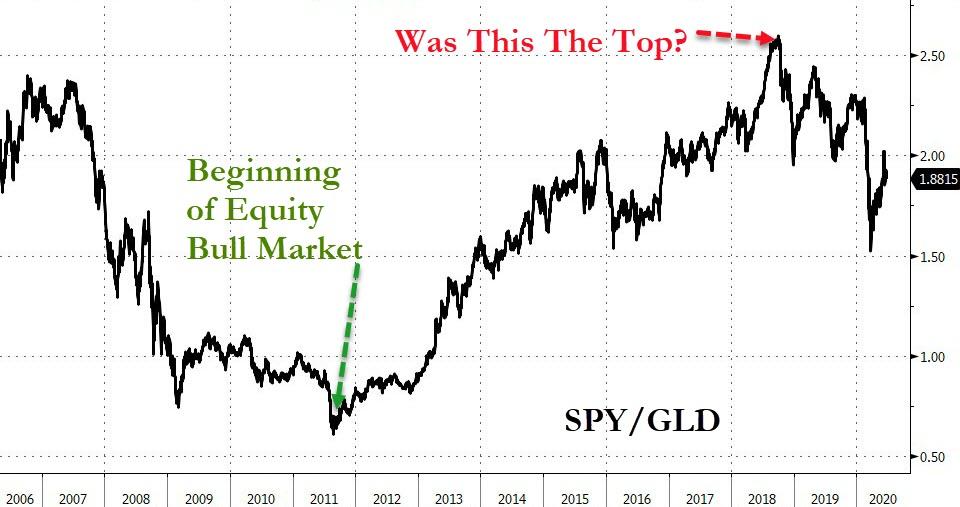
Let’s take a longer-term look at this ratio.

Although equities bottomed in nominal terms back in early 2009, the post-financial crisis low for equities in gold terms didn’t occur until the second half of 2011. From there, stocks in real terms soared for seven years in an extraordinary and historic bull market. Then, in September 2018, something changed.
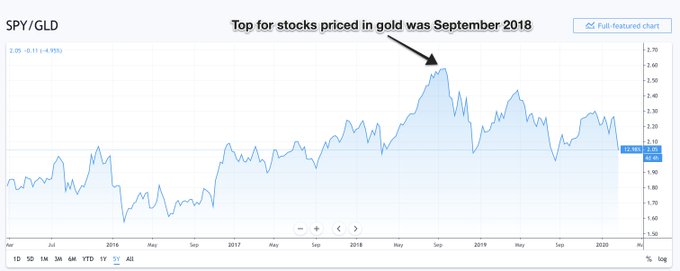
Equities suddenly stopped outperforming gold, with the ratio topping out just under 2.60. Gold even outperformed the tech-heavy Nasdaq since then, though not by nearly as much. Point is, if you can just own a shiny rock and outperform all the broad stock indices then what you’re witnessing isn’t really an equity bull market, but something else. Something much bigger.

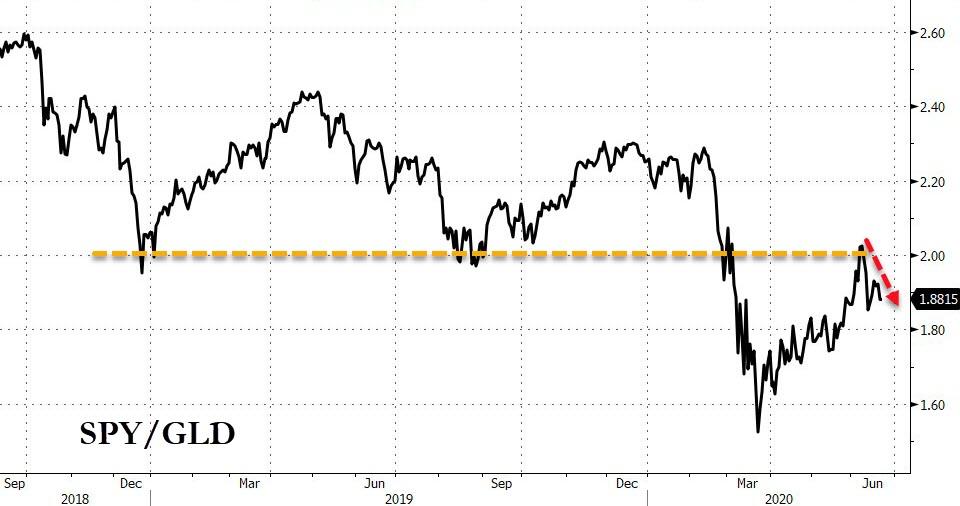
Throughout 2019, I paid close attention to the SPY/GLD ratio and felt the 1.95-2.0 area was important. My sense was when this level broke it would represent some sort of watershed moment. This level broke in early 2020 as covid-19 spread around the world.Michael Krieger@LibertyBlitz
I’ve highlighted this chart often over the past year. It’s the stock market priced in gold.
When it breaks 1.95-2.00 area and stays below, you’ll know the world has truly changed.
We’re testing that level again today, but not yet below.

61Twitter Ads info and privacy24 people are talking about this
That area broke easily, and the ratio quickly plunged all the way down to just north of 1.50 in the course of a few weeks. Then the Federal Reserve took out its nuclear weapons in order to artificially support financial asset prices, and equities soared. SPY/GLD has jumped 25% over the past three months, and is all the way back to 1.88.
As such, we’re pretty much right back to that original breakdown area I discussed previously. If I’m correct and September 2018 represented the real high for equities this cycle, this ratio should start to turn back down pretty soon. This also lines up with my view that we’re still in the early stages of a monster bull market for precious metals, one that will really get going later in 2020 and last several years.
Receive a daily recap featuring a curated list of must-read stories.
This doesn’t mean equities will go down in the years ahead. They could go down, they could stay flat or they could rise, but I think precious metals (and bitcoin) will vastly outperform, and what we just saw over the past three months was more of a snapback in a SPY/GLD ratio that moved too far too fast. Based on thoughts I have around price and cycles, this should start to become clear over the next 2-3 weeks. If it’s not obvious by then, my thoughts around timing are likely wrong.
Bottom line, I think the big snapback move we just saw in equities vs. gold is now on shaky footing, and I suspect the recent trend could reverse by early July.
Like everyone else who makes such forecasts, there’s a good chance I’ll be wrong. I’m not a guru and I don’t pay particularly close attention to this stuff anymore, so take it all with a grain of salt. This is me sharing thoughts because many of you like to hear my market opinions from time to time. Hopefully it helps.
* * *
Liberty Blitzkrieg is an ad-free website. If you enjoyed this post and my work in general, visit the Support Page where you can donate and contribute to my efforts.
Source : ZeroHedge
StevieRay Hansen
Editor, Bankster Crime
![]()


